Neo4j and NASA: When graph database technology really is rocket science

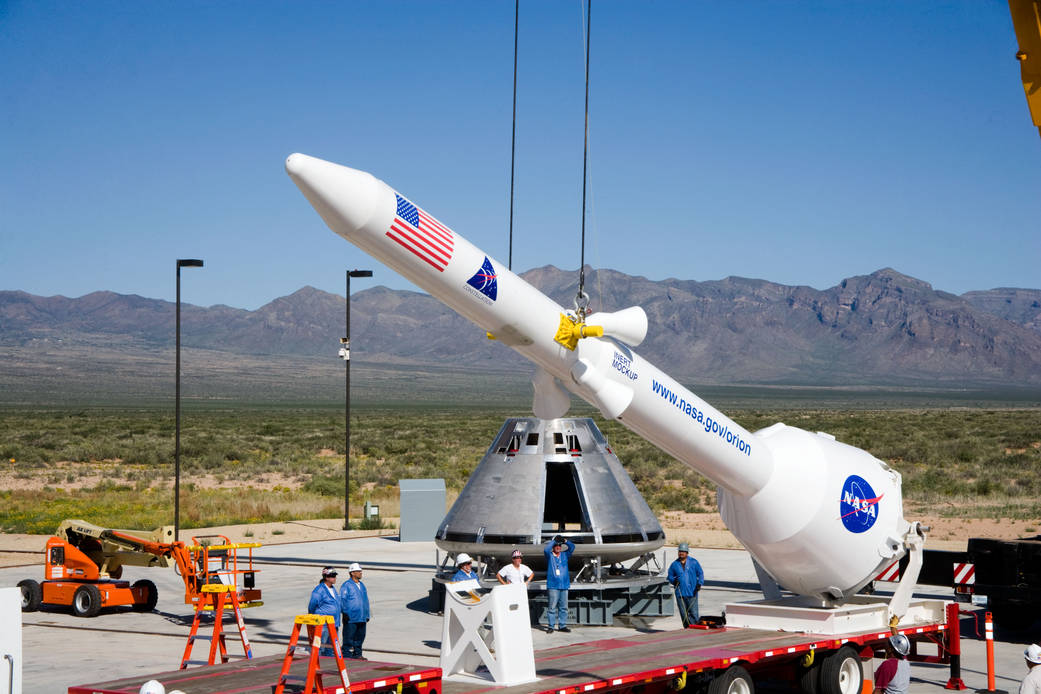
Target Mars: NASA's Project Orion is being helped along with graph technology from Neo4j.
NASA has been using graph database technology from Neo4j to help with cataloguing and making sense of the mountain of engineering knowledge data that space agency has collected over the last 60 years.
One of the ways in which Neo4j has been used is in the development of the up-righting mechanism on the Orion spacecraft. This vital piece of equipment is designed to ensure that the craft doesn't wind up the wrong way up after splashing back down to Earth. But the last time an up-righting mechanism was needed was in the Apollo programnme and exactly how to make it work was lost in NASA's knowledge mountain a long time ago.
Enter Neo4j, software that is designed to extract pertinent information from vast piles of data: using it NASA got the information it needed out of the mountain in four hours.
NASA's chief knowledge architect, David Meza said that without the help it could have taken two years. ZDNet talked to him to find out what else he was using the software for.
ZDNet: How did you first come to look at Neo4j?
Meza: It was some time ago - close to four years - when we made the initial decision. I had looked at Neo4j before it even had its browser-based interface - it was more of a command line interface then.
I have always been a fan and a user of network-type visualisation - mind mapping and other things that can show connections and patterns.
When I came across Neo, I was looking for an application that was focused more on how you could develop a database that itself focused more on a graph relationship and graph properties. That got me interested and I started playing around with graph technology.
I didn't really get deep into it until probably a year after that when they got their first web-based interface out. I started doing more and more work on that because it was a little easier for me to show people how it worked.
That's probably when I first started using Neo4j.
So what attracted you to it?
The capabilities that allowed me to look at relationships a lot easier or, in other words, a lot more like a human may look at relationships. To be able to see patterns around different types of nodes, different types of groupings.To see how they are interconnected and visualise it all in one image, I guess. And do that without having to grunt and grunt through long lists of documents.
Can you give us some idea of the scale of the projects you were doing it for in terms of the number of variables?
Yes, that was one of the benefits of graph databases in this case Neo4j. It was fairly easy to add more and more data on top of the model without having to re-structure your schema, which is what you would have to do in a SQL type of relational database. This allows me to set my model and then add to my graph model as I see new topics or new connections that may arise from within my domain.
You have been using this for a long time so presumably you have been building on this all the time?
Slowly. It depends on the domain and when I can connect it like the Lessons Learned database. I continue to add more documents to that but one of the things I have to do as I add more lessons is properly put them in the right topics.
I am working right now on trying to develop a way to do more predictive modelling so that I don't have to re-run [the database] all the time. I can try to predict where the next group of lessons will fall into and try to add more continuity. If you are familiar with topic modelling, every time you run it, you are going to get a different set of topics based on the probabilities because it is always looking at the probability of a word falling into that document.
So I am trying to find a way to make a little more static, in the sense that these documents are falling into that topic and I am adding and more documents and I want to be sure that they are lining up properly.
Having all that stuff in Neo4j or another graph database is very helpful but then I have also worked with other groups on different types of domains from publications, from research investigations to meeting action items, looking at who has been assigned to work on which actions.
We're also looking at things like the common words coming out of comments and how they may be aligned by different sentiments. These are all things that we are exploring from a graph database perspective.
How do you find Neo4j as a tool when you are running these types of projects? Obviously it must be helpful, but is it flexible enough for you?
Well it depends on the domain or the dataset that I am looking at but I work a lot on unstructured data. I find that generally it is very helpful because of the connections that I am doing. But it all relates back to how I look at my data, and how I try to extract knowledge from that data and I use a concept which I call Knowledge Architecture.
Meza: "Knowledge architecture is a combination of knowledge management, informatics and data science."
This is a combination of Knowledge Management, Informatics and Data Science. It is the convergence of those three things together that allows me to extract knowledge from my data.
The Knowledge Management piece is the strategy - the different types of techniques and methods of how I store, create and identify my data.
The Informatics piece is the framework of the applications that I utilise to transmit the data to my end-users, in this case Neo4j.
The data science is how I group and cluster and identify the documents and actually get that knowledge out of there.
In the case of those lessons learned I apply topic modelling. I deal with the topic modelling that I apply to those lessons to be able to help users find the answers a lot faster. I use correlation analysis to show documents that were similar to each other and to be able to get that correlation across different topics.
I use those three things together to get that information which, in turn, allows me in the case of Neo4j to be a bit more robust in how I manage to present that information to my end users.
Is this Knowledge Architecture something that you developed yourself?
It is something that I had read about but I have never come across anybody that uses these same three things. On Knowledge Architecture - if you do a search on it - you will find some things but people define it differently. I did come across a gentleman, Tom Reamy, who talked about knowledge management from the scope of knowledge management and informatics.
I kind of liked that concept, but as I was looking through it, I realised that there was something missing and that was the data science piece. I thought that we had knowledge management and informatics but we still did not have a good way of extracting that knowledge from that data.
So I incorporated data science into that model and built upon that model to be able to expand upon it and build a mechanism that allows anybody, depending on what data they have, to utilise these concepts and get the information out of that data.
Are you working with other people or organisations on this?
I collaborate with other organisations in order to look at information and kind of figure out new techniques and incorporate those techniques within the knowledge architecture framework.
I've worked with people like the US Census Bureau, the Federal Reserve and we have a group of individuals here that we call the NASA Datanauts - a group of non-NASA individuals that are asked to join this group once a year for a collaboration exploring NASA Open Data.
They aim to come up with different techniques on how we can analyse it, share it and visualise it. So I work with them a lot to look at different ways of doing things - to share my knowledge and get some knowledge from them.
So I collaborate with them and I also work with, and share information with, outside groups, Elder Research, BASF and Exxon Mobil.
I do try to share information with organisations and I do, at least, try and share my publicly available data.
I understand you are using this with Project Orion. Is that the only collaboration?
My group supports the entire centre here at Johnson Space Centre and to a degree NASA and some of the other centres so anybody, from any of the centres, can come and look at the information we have.
An engineer working on Orion can come and look at the Lessons Learned database along with the engineers from any of the other projects.
What are your next steps?
One of my guys is working on enhancing the Lessons Learned database here to try and spread it across the various Lessons Learned databases we have.
Off the top of my head I could name 20 to 30 databases spread out across the different centres. I am working with some of the other knowledge offices across the agency to try to combine these into "one shop" combined Lessons Learned.
My current big project now is to look at the knowledge diffusion of the publications that have been generated by the investigations coming from the International Space Station.
Now from these publications you get not only the research that has been provided but also some tangible items that may have been developed. Things such as patents or software or applications. I want to see how that information is being diffused across the knowledge economy and see how that impacts not only academia and education, but also industry and government and policy.
I want to see how far that information is spread and diffused so we can show some type of value that is being generated from the work that is done on the International Space Station.
You make the idea of spreading those vast quantities of information around various agencies sound straightforward but I imagine that it's very complex to do?
It can be. You're right that the concept that we are trying to do is fairly straightforward but trying to gather together all that information in so many different formats and make it readable and accessible not only to the end user but to the methodology or the algorithms that we are trying to apply us very complex.
For a start, we had to clean all that data in a particular way for us to be able to analyse it and that probably - like anybody who does any kind of data science will tell you - takes up 60 to 80 percent of our time.
I suppose that is not helped by the fact that it sometimes seems that half the IT industry is focused on finding new ways to create different formats?
That's right and that's one of the things that I talk about in presentations: trying to formulate some kind of master data management plan that allows you to have similar formats and that plans how you store and create the metadata that you associate with that data.
So if you have all of that in some kind of format that is easily accessible - whether it be XML , Json or some other way -so as to be able to extract that, it makes it easier to analyse that information and get those nuggets of knowledge out of that data for the end users. But that just takes time.
Do you think, at NASA, that you could knock some heads together on that one?
Well, we can try. But like any other organisation which is spread out, it's just a matter of showing the value of doing something like that and showing how we can speed up processes by having that type of information in a readable format and then showing the value again when we've analysed it.
Once you start showing them that value then they start getting on board. That's been my biggest surprise, or perhaps not surprise but my gratification, that as I show them the value of the information that they are getting, then they really jump on board.
Then what do you think is the biggest thing that you have got from using Neo4j?
Being able to demonstrate a different way of not only storing your information in a different type of database but of being able to show how straightforward it can be.
It allows the information to be visualised in a way that is understandable to the end user. Neo4j and some of its newest capabilities allows you to get that information to the end use quicker.
You must find this an exciting area to work in?
I do, because there are still a whole lot of possibilities out there. There are many different types of domains, it's not just about Lessons Learned. It's just a matter of how we can get, store and visualise information in a different way to get at all of those patterns.
I had a guy recently who is looking at a very specific domain within some research that he is doing with gene therapy.
To be able to see where the connections are, where those gaps are, who are the big players and so on. We are working with him to do that, to be able to expand it out into different types of research, different methodologies and he sees the value himself of being able to put that into a graph.
It's just exciting to see new people come on board and say, "Hey, I think this will work really well in a graph, what can we do?" This is a new way to experiment and find new ways to visualise the data.
Further Reading:
NASA picks research teams to tackle advances in drone, self-driving car tech
NASA Hybrid Reality Lab combines VR and the real world