Office 2013 brings BI, Big Data to Windows 8 tablets

Yesterday, Microsoft released the Preview (beta) of Office 2013. There’s lots of coverage out there on what this means for content creation on tablets…but in most of those analyses "content" implicitly refers to spreadsheets, word processing documents, slide presentations and so forth. Is there more to this story?
Excel is a (Big) data tool
To me, Excel is about much more than numbers and formulas. It’s about analytics. For more than a decade, Excel has been able to query not just relational databases, but OLAP cubes as well. The addition of the free PowerPivot add-in brought true in-memory analytics capabilities to Excel, and corresponding (but optional) capabilities in SharePoint.
For PowerPivot models that are deployed to SharePoint, the Power View data visualization component of SQL Server 2012, introduced earlier this year, can be used to analyze that data really easily. Add in Microsoft’s ODBC Driver for Hive and Hadoop, with which PowerPivot is compatible, and there’s a Big Data story to all of this as well.
What about on tablets?
So now that a tablet-friendly Office 2013 has hit the Preview stage, and given that we are just a few weeks away from the release to manufacturing of the Windows 8 operating system, the question is how well will Excel's analytics technology work in that environment? The answer, at least so far as Intel and AMD x86-based tablets and PCs are concerned, is quite well. In fact, better than before.
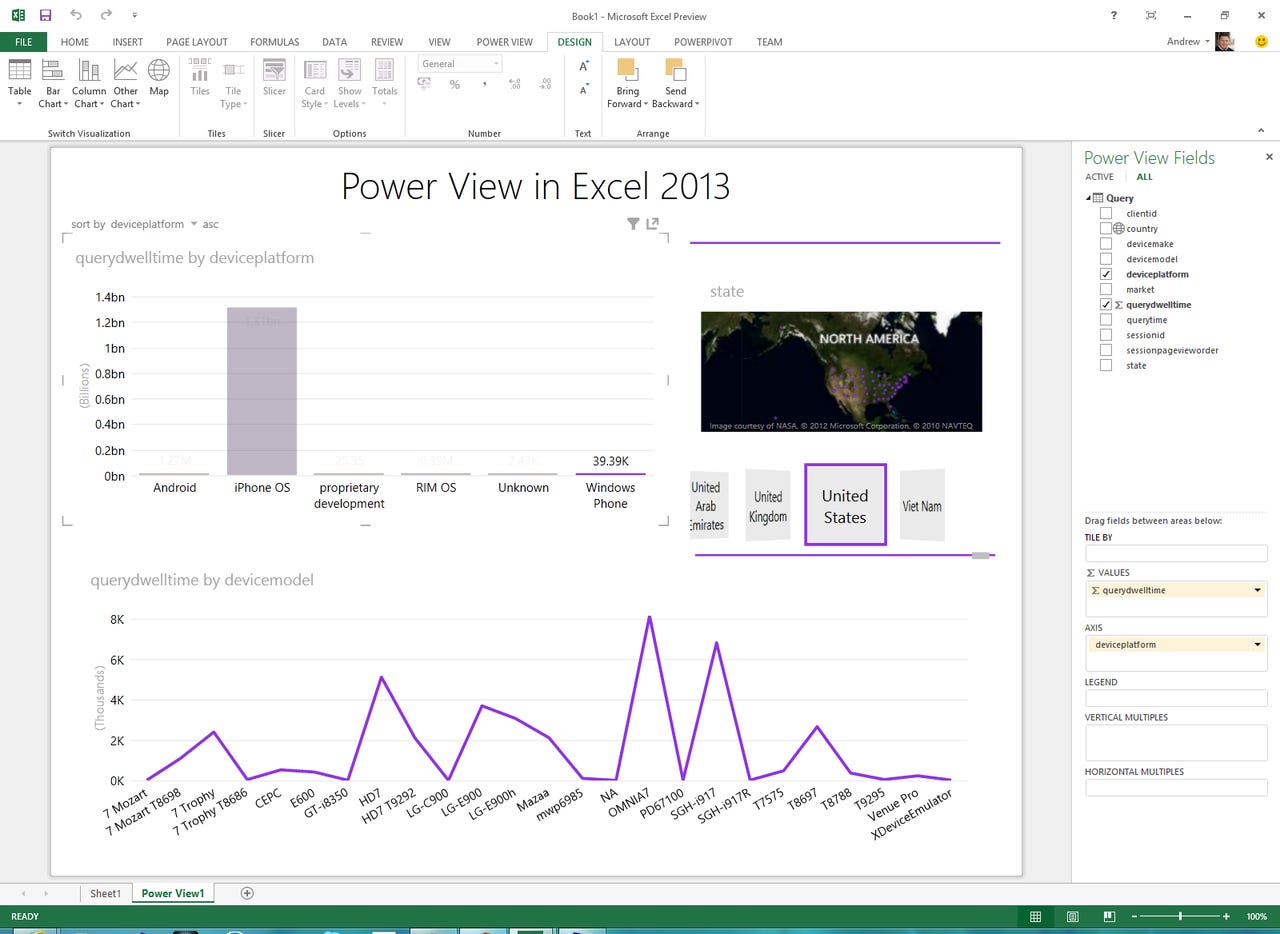
Not only is there a PowerPivot add-in for the Excel 2013 Preview available right now, but Microsoft has also implemented a Power View add-in for Excel, freeing customers from the dependency on SharePoint. The following screenshot shows you how to put it all put together. What’s shown below is a Power View report, built on a PowerPivot model, whose data was sourced from Microsoft’s Hadoop on Azure:
The above report (click it to enlarge to full-size) is based on some sample cell tower data in Hive format. The top visualization shows "query dwell time" at the towers aggregated by smartphone platform in column chart format, while the line chart at the bottom shows query dwell time aggregated by handset model. Selecting a platform in the column chart will filter the data shown in the line chart. At the top right, a tile and map visualization allows filtering of the charts by country and state or province.
Have your data; eat it too
What’s neat about the combo of Windows 8 and Excel 2013, is that you don’t have to build on your PC first and look at it on your tablet second. With Windows 8, that PC/tablet distinction goes away. The query, modeling and analysis work and the consumption is all done on the tablet.
As I mentioned, the PowerPivot and Power View add-ins are installed by default. But they are not automatically enabled. You have to do some menu/dialog box acrobatics to turn them on, but it’s a one-time set-and-forget requirement. If you’d like to try it yourself, click through File|Options|Add-Ins|Manage COM Add-Ins|Go… and then enable the add-ins by checking them off and clicking OK:
Caveat Emptor
This is very exciting stuff. But I must point out that while this works under Windows 8 on Intel- and AMD-based hardware, that does not automatically mean that it will also work in Windows RT on ARM-based devices. In terms of Microsoft’s Surface tablets, that means the Surface Pro will definitely be able to do what I’ve shown here; meanwhile, the lower-end Windows RT-based Surface tablet might not.
We’ll just have to wait and see how that plays out once ARM-based Windows RT devices, and their implementation of Excel 2013, are available. Regardless, Microsoft now has a mobile BI/Big Data story, where it had virtually none before.
