Sisense Extense Framework and apps deeply embed analytics

Business intelligence software is very powerful, and self-service BI brings that power to business users and others who may lack BI expertise. But the very existence of BI software is based on a problematic premise: that it's OK to make users leave the applications they use during the course of their day in order to analyze data and derive insights. In fact, the best way to help business users form data-driven habits and behaviors is to meet them where they are, and embed analytics capabilities in the software they use to create their work product, document their activity and collaborate with their colleagues.
While some BI platforms define embedded analytics as the ability to inject full-fledged visualizations, reports and dashboards into an external application, others provide a more granular interface, pushing in raw data sets, allowing them to be interrogated in code or presented and rendered using the application's native interface. The former approach may provide a "quick win," but may also limit functionality. For example, exporting a native visualization into a PowerPoint slide will look good, but the image may be static, thus ruling out interactivity and requiring the process to be repeated when the underlying data changes. The latter, more granular, approach often makes for a tighter, more customized integration. But it can also require a lot more work.
Embrace, extend and...flourish?
Sisense, in the release of its Extense Framework last month, may have found a middle ground, though. While the announcement dates back to July 21st, Sisense's Chief Product and Marketing Officer, Ashley Kramer, at my request, was kind enough to brief me on the news about a week later, while I happened to be on vacation. I requested this vacation briefing because the intersection of software development and analytics is very important. I'm covering the news somewhat belatedly, but I'll provide some detail and commentary that should compensate for the delay.
I mentioned that Sisense may have found a middle ground between simple embedded visuals and a granular developer-oriented API. That's because, in addition to the Extense Framework itself, the company is releasing "Infused Analytics" apps, built with the Framework, that implement the integration into major business apps. Out of the gate, the company is releasing add-in apps, available on its marketplace, that leverage the Extense Framework within Slack, Salesforce, Google Sheets and Google Slides, allowing customers full access to their data and the Sisense engine, from within the host application's native interface.
As as result, customers get the power of the detailed API without having to do the detailed integration work themselves. In addition, Sisense is providing a more generic integration with Google Chrome which, according to Sisense's press release, lets you "Connect to different Sisense instances and display KPIs or use the [Extense Framework] to query information."
At ZDNet's request, Sisense produced a demo video showing the Slack, Google Sheets and Google Slides integration in action. The remainder of this post describes in-depth the capabilities shown in the video, along with a few corresponding screen grabs. You can also, of course, watch the video in full.
No-slouch Slack integration
Let's start with Sisense's Slack integration, which is noteworthy for a couple of reasons. First off, the data pulled from Sisense can be presented in a tabular format that is typographically and otherwise native to the Slack chat environment (shown in Figure 1, below), or as bar graph visualizations rendered using simple graphics characters (shown in Figure 2, below). While perhaps primitive, this integration is nonetheless lightweight and avoids the need to bring a potentially distracting full-fledged BI visual into the collaborative chat.
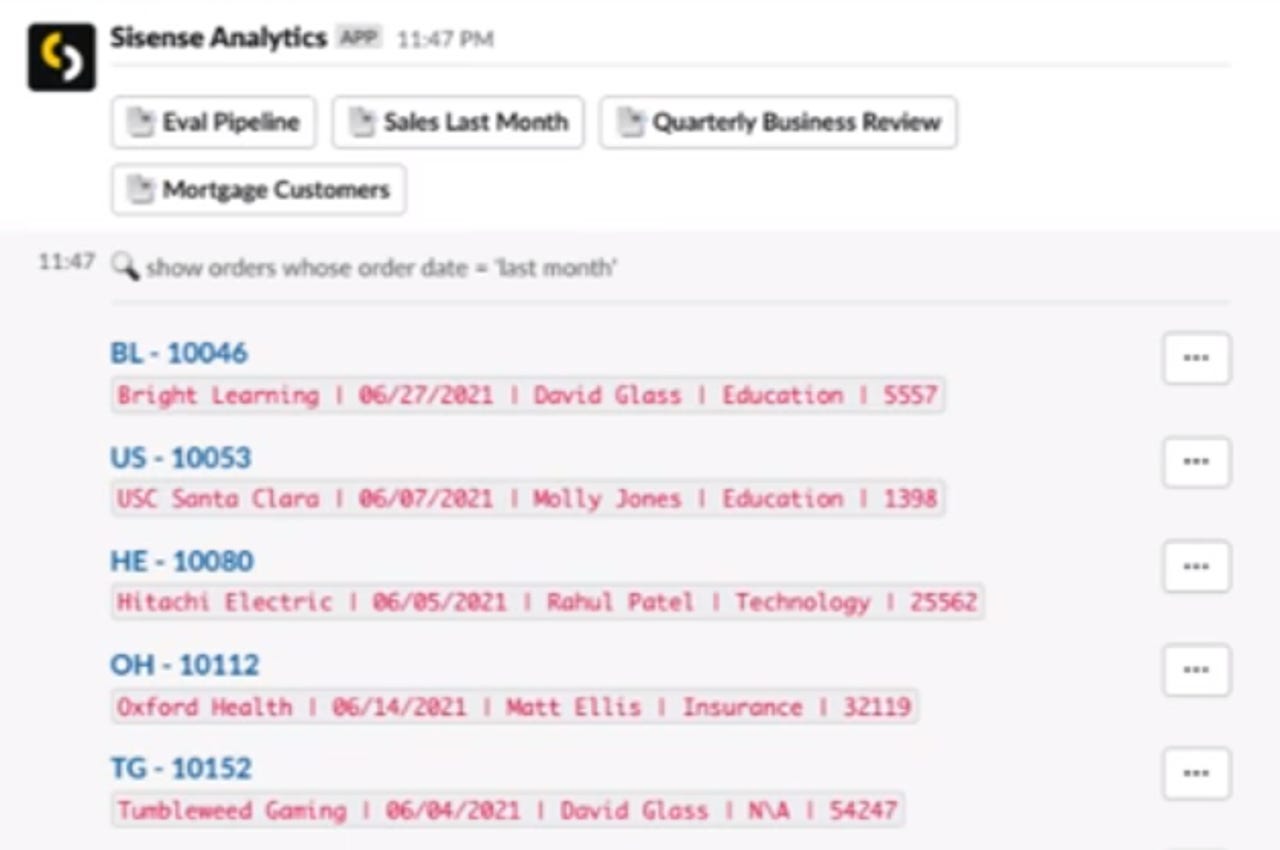
Figure 1: A Sisense data set presented in a Slack channel, rendered using Slack's native text capabilities.
Figure 2: A bar chart in a Slack channel, based on Sisense data, rendered using text and simple graphics characters. Note the dimension that determines the data shown on each row can be changed by making a new selection in the drop-down list above the visualization.
Second, though, Sisense has mashed up the Slackbot experience with its own natural language query facility, to allow insights to be delivered in response to typewritten, plain-English business questions entered in a Slack channel. This goes beyond mere embedded analytics, delivering augmented analytics, without requiring users to leave the Slack environment. Better still, these queries aren't disposable -- they can be bookmarked and returned to later, without having to formulate the question a second time.
Gee, sweet
Even cooler, the bookmarks created in one Infused Analytics application are available in another. This means a Slackbot-originated query can be bookmarked and referenced in, for example, Google Sheets, where the data set is returned in a tabular form within the spreadsheet rows and columns themselves (see Figure 3, below). Not only is the data streamed in, but certain data profiling statistics -- like the count of unique values, or the sum of all values, in a column -- are shared as well. A button (not shown in Figure 3) is provided to perform a refresh when the underlying data changes, without the user having to recreate the spreadsheet from scratch.
Figure 3: A Sisene data set presented in a Google Sheet. Note the count of distinct values (or sum of the values, in the case of the last column) shown in the second row.
In Google Slides, users can reference the same bookmarks and bring the data back in the form of a summary (presented as text bullets in the slide, as shown in Figure 4, below), a table, a chart (presented as a native Google Slides bar chart or other chart type of the user's choosing), including a pre-configured Top/Bottom 10 visualization.
Figure 4: Summary information, aggregated from a Sisense data set and rendered as standard bullets in a Google slide. Note also the "Summary," "Table," "Top/Bottom 10" and "Create Chart" options, for each Extense Framework bookmark, in the task pane at the right of the screen.
More to come
Sisense says this first batch of Infused Analytics apps is just the beginning. For example, support for Google Docs will join that already provided for Sheets and Slides, and comparable add-ins for Microsoft Office 365 and Teams are planned as well. The strategy here is a valid, and somewhat uncommon, one for a BI company: reduce friction for users, get your own software out of the way and provide a conduit to your platform's raw analysis capabilities, rather than its fit-and-finished visualizations. The traction these capabilities generate for Sisense may help it out of the commodity BI space and into the realm of strategic analytics partner to its customers.